2016 Reebok CrossFit Games OpenApr 5, 2016 by Armen Hammer
Noah Ohlsen Is The Most Dominant Men's Open Champion Ever
Noah Ohlsen Is The Most Dominant Men's Open Champion Ever
Noah Ohslen, the 2016 CrossFit Games Open Champion, is the most dominant men's Open Champion in the history of the Open.Yesterday I put out a ranking of the

Noah Ohslen, the 2016 CrossFit Games Open Champion, is the most dominant men's Open Champion in the history of the Open.
Yesterday I put out a ranking of the women's Open Champions based on dominance, looking at both level of competition as well as margin of victory. Today we're ranking the male Champions. First off, here's the ranking. You can find the methodology below the ranking.
[instagram url="https://www.instagram.com/p/BDy1WYPmkR3" hide_caption="0"]
Follow Noah’s training and preparation for 16.5 and finishing the 2016 CrossFit Open season in "Noah | Open Season”.
[instagram url="https://www.instagram.com/p/BDwhU7Vs0K2" hide_caption="0"]
[instagram url="https://www.instagram.com/p/rBKG55M0JE" hide_caption="0"]
[instagram url="https://www.instagram.com/p/8RqiE8M0LE" hide_caption="0"]
[instagram url="https://www.instagram.com/p/lL_fg-hxmu" hide_caption="0"]
[instagram url="https://www.instagram.com/p/4As9uTk5gk/" hide_caption="0"]
Here's the process I went through to come up with this ranking:
Using the top 10 finishers of each year as my sample, I averaged their points and subtracted the range from the average to get a measurement of difficulty. The closer that measurement is to 0, the tougher the competition that year. Then I took the average points of 2nd through 10th and divided that by the points of 1st place to get what I call "local dominance": as in how badly did the Champ beat the rest of the top ten in that year. I then divided local dominance by difficulty and used the absolute value of that to rank the Champs, where a higher value is a more dominant champion.
Let's break that down a little more in depth.
Dominance is about how well an athlete performs compared with the rest of the field. I measured what I call Local Dominance by comparing the Champions total points with the average number of points scored between 2nd and 10th place. Remember that the points are just an aggregate of rankings across the various events of the Open, so averaging the scores gives us a version of average ranking across the Open events. By comparing to 2nd through 10th, we get a chance to see just how well the Champ did compared with his or her closest competitors.
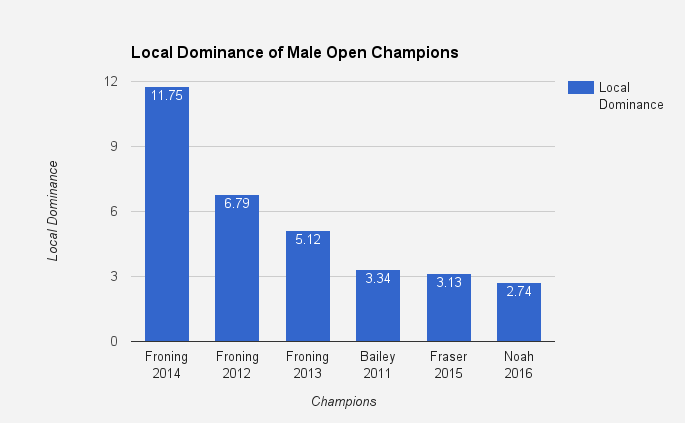
If we were using only this measurement, Rich Froning's 2014 Open win would easily win:

But Local Dominance isn't enough to compare across different years of the Open. It only tells us how impressive the Champs' performances were compared to the top 10 of that year.
Comparing dominance across different years of competition is challenging because we don't really have a way of comparing one year of competition to another year of competition. To solve this, I decided to look at a measure of Difficulty. Golf is a good analogy here. Comparing difficulty between golf championships is difficult because the courses are different. One way to solve this is to take the average score of the top finishers in one championship and compare that with the average score of another championship. If we have generally the same participants, this gives us a way of saying one competition is harder to win compared to another.
Averaging the scores of the top 10 will essentially give us the average finish across the events. If the average number of points is 500, then, on average, the finish was 100th in 5 events. If the average number of points is 100, then, on average, the finish is 20th in 5 events. A competition where everyone places in the top 20 is harder to win than a competition where everyone places in the top 100 because the level of competition is that much higher.
That said, the average isn't enough because you can get the same average score with a lot of different combinations of numbers. In order to normalize Difficulty, you've gotta also look at the range of scores. The idea here is the smaller the range, the higher the level of competition. If everyone in the top 10 is within 50 points of each other, you've got a very tight competition compared to a competition where 1st and 10th are 400 points apart.
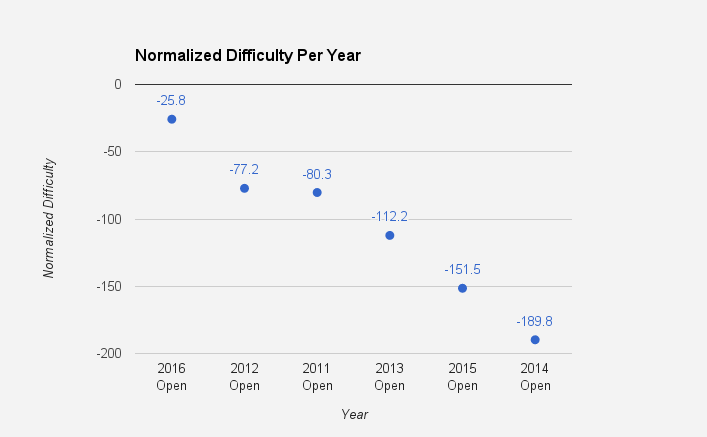
To normalize Difficulty, I subtracted the range of the top 10 scores from the average of the top 10 scores. The idea here is that the larger that resulting number (Normalized Difficulty), the closer the competition and, therefore, the harder it was to win. Here's a comparison of the Normalized Difficulty of each year of the Open on the men's side:

Now we come to the actual heart of this argument. Local Dominance just tells us how well the Champ did compared with the top 10 of that year's competition. Only by combining Local Dominance with Normalized Difficulty can we actually normalize Dominance and compare across each year. To get Normalized Dominance, I divided Local Dominance by Normalized Difficulty. I took the absolute value of that result because of a few reasons. First, because the Normalized Difficulty in each of these years is negative, we'd get negative numbers as a result of that division. Logically, we're looking for the biggest actual distance from 0 as our Normalized Dominance (if a particular year was very difficult to qualify, we'd be dividing by a negative number close to 0 which would give us a larger result than dividing by a negative number farther away from 0).
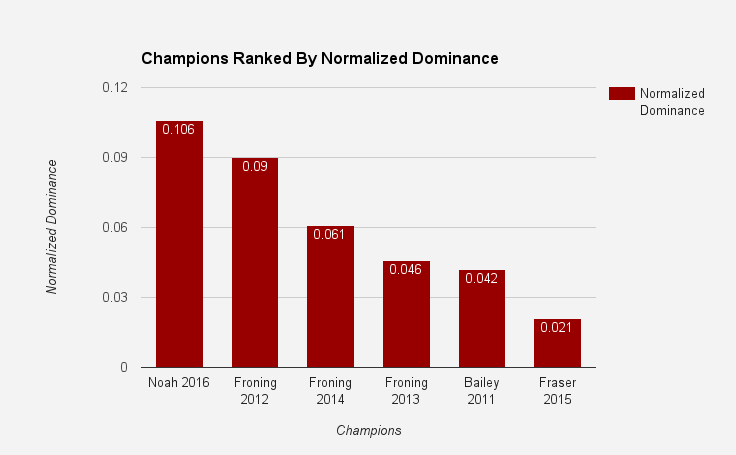
So taking the absolute value of that result tells us the distance from 0 and the largest value of Normalized Dominance gives us a comparison between Open Champions:

If you have any questions or comments, let me know!
Yesterday I put out a ranking of the women's Open Champions based on dominance, looking at both level of competition as well as margin of victory. Today we're ranking the male Champions. First off, here's the ranking. You can find the methodology below the ranking.
The Most Dominant Male Open Champs
1. Noah Ohlsen, 2016
[instagram url="https://www.instagram.com/p/BDy1WYPmkR3" hide_caption="0"]
Follow Noah’s training and preparation for 16.5 and finishing the 2016 CrossFit Open season in "Noah | Open Season”.
2. Rich Froning, 2012
[instagram url="https://www.instagram.com/p/BDwhU7Vs0K2" hide_caption="0"]
3. Rich Froning, 2014
[instagram url="https://www.instagram.com/p/rBKG55M0JE" hide_caption="0"]
4. Rich Froning, 2013
[instagram url="https://www.instagram.com/p/8RqiE8M0LE" hide_caption="0"]
5. Dan Bailey, 2011
[instagram url="https://www.instagram.com/p/lL_fg-hxmu" hide_caption="0"]
6. Mat Fraser, 2015
[instagram url="https://www.instagram.com/p/4As9uTk5gk/" hide_caption="0"]
Defining "Dominance"
Here's the process I went through to come up with this ranking:
Using the top 10 finishers of each year as my sample, I averaged their points and subtracted the range from the average to get a measurement of difficulty. The closer that measurement is to 0, the tougher the competition that year. Then I took the average points of 2nd through 10th and divided that by the points of 1st place to get what I call "local dominance": as in how badly did the Champ beat the rest of the top ten in that year. I then divided local dominance by difficulty and used the absolute value of that to rank the Champs, where a higher value is a more dominant champion.
Let's break that down a little more in depth.
Dominance is about how well an athlete performs compared with the rest of the field. I measured what I call Local Dominance by comparing the Champions total points with the average number of points scored between 2nd and 10th place. Remember that the points are just an aggregate of rankings across the various events of the Open, so averaging the scores gives us a version of average ranking across the Open events. By comparing to 2nd through 10th, we get a chance to see just how well the Champ did compared with his or her closest competitors.
If we were using only this measurement, Rich Froning's 2014 Open win would easily win:
Local Dominance Ranking

But Local Dominance isn't enough to compare across different years of the Open. It only tells us how impressive the Champs' performances were compared to the top 10 of that year.
Comparing dominance across different years of competition is challenging because we don't really have a way of comparing one year of competition to another year of competition. To solve this, I decided to look at a measure of Difficulty. Golf is a good analogy here. Comparing difficulty between golf championships is difficult because the courses are different. One way to solve this is to take the average score of the top finishers in one championship and compare that with the average score of another championship. If we have generally the same participants, this gives us a way of saying one competition is harder to win compared to another.
Averaging the scores of the top 10 will essentially give us the average finish across the events. If the average number of points is 500, then, on average, the finish was 100th in 5 events. If the average number of points is 100, then, on average, the finish is 20th in 5 events. A competition where everyone places in the top 20 is harder to win than a competition where everyone places in the top 100 because the level of competition is that much higher.
That said, the average isn't enough because you can get the same average score with a lot of different combinations of numbers. In order to normalize Difficulty, you've gotta also look at the range of scores. The idea here is the smaller the range, the higher the level of competition. If everyone in the top 10 is within 50 points of each other, you've got a very tight competition compared to a competition where 1st and 10th are 400 points apart.
To normalize Difficulty, I subtracted the range of the top 10 scores from the average of the top 10 scores. The idea here is that the larger that resulting number (Normalized Difficulty), the closer the competition and, therefore, the harder it was to win. Here's a comparison of the Normalized Difficulty of each year of the Open on the men's side:
Normalized Difficulty Per Year

Now we come to the actual heart of this argument. Local Dominance just tells us how well the Champ did compared with the top 10 of that year's competition. Only by combining Local Dominance with Normalized Difficulty can we actually normalize Dominance and compare across each year. To get Normalized Dominance, I divided Local Dominance by Normalized Difficulty. I took the absolute value of that result because of a few reasons. First, because the Normalized Difficulty in each of these years is negative, we'd get negative numbers as a result of that division. Logically, we're looking for the biggest actual distance from 0 as our Normalized Dominance (if a particular year was very difficult to qualify, we'd be dividing by a negative number close to 0 which would give us a larger result than dividing by a negative number farther away from 0).
So taking the absolute value of that result tells us the distance from 0 and the largest value of Normalized Dominance gives us a comparison between Open Champions:
Normalized Dominance Ranking

If you have any questions or comments, let me know!